KIIDs Recognition: a real case of computer vision application in RPA
Although 2018 is expected to be the year that Artificial Intelligence (AI) arrives in the RPA world, it is currently difficult to find many real life applications or concrete examples of robots that demonstrate such capabilities. There is still a long way to go for Intelligent Automation programs to fully adopt cognitive technologies!
We recently worked on an interesting case that presents as a credible example of computer vision use in an RPA scenario. At its core, the scenario is a highly specialised case of data capture from a specific type of PDF document by a back office team at a business process outsourcer (BPO).
The problem for our client arose from a European Commission directive that has forced companies that distribute Investment Funds to publish a document known as KIID (Key Investor Information Document). The objective is to simplify the most relevant information of a Fund, making it much simpler and easy to understand for the investors.
The KIID is a file, usually a PDF, where the following Fund key data must be reflected:
- Fund objective and investment policy.
- Costs and associated expenses.
- Historical profitability.
- Fund risk profile.
Since this document must be constantly updated, Funds distributors (banks and investment companies), are obliged to capture this information to integrate it into their databases and thus be able to offer it to customers via their systems.
Being a repetitive, mechanical and high-volume job (more than 100,000 documents updated several times a year), this is typically outsourced through a bureau which makes it an ideal business case for automation . We were able to successfully deploy a Jidoka robot to capture and process this information.
Most of the information in the KIID document is structured, making it possible to program rules based on the patterns in the PDF structure, all except for the Fund Risk Profile data.
A risk profile, rated on a scale of 1 to 7 (ordered from lowest to highest risk), is displayed visually in the document, clearly indicating the risk level of the Fund. Unfortunately, each fund manager has developed their own visual style using different colours & gradient schemes, as can be seen in the image below that highlights six different examples.
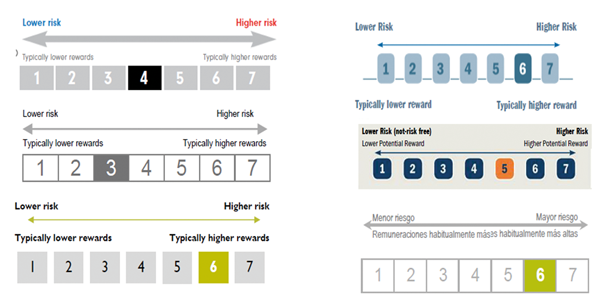
Therefore, the challenge was to use artificial vision techniques to detect the number associated with the level of risk with absolute precision, given the sensitivity of the data for the investor.
In the following video, we show the Jidoka robot implemented.
The robot firstly uses a technique to identify tables within the document, and once it has selected the right table containing the risk profile, it ensures that it is composed of numbers, detecting which number is the marked one. But there are KIIDs where the numbers are not framed as a table, so the robot must also use a second method to locate the numbers instead based on colours.
Logically, the robot does not "see" the risk scale in the same way as a human. We need to adapt the document and make it "visible" to a machine. These adaptations can assimilate to what our brain does (while still very far from it) carrying out the information that reaches our eyes in the form of light.
The robot takes the PDF document and transforms it into an image, to later transform it into numbers, vectors, and matrices, a much more suitable mode of information for it to process. By the means outlined, we have taught the robot to find the risk scale using dual vision techniques.
In the first place, the robot looks for patterns in the image that resemble a table. It erodes, dilates and even performs the binary of the image in search of this pattern, discarding those patterns that do not fit within the initial parameters (width, height, position on the page, etc.). After identifying several tables that are present in the document, it must then find the one that is the risk scale.
How to recognise then which of the tables is the correct one? The answer is, again, by observing it via artificial intelligence, going through the images and analysing their characteristics.
In the case of the risk scale table, its main characteristics will include: a predominant colour (unselected risk values) and at least one other secondary colour (the marked value). This secondary colour is the interesting one. Once known, the robot focuses its attention on the correct box, and all that remains is to extract the number from the box marked using the OCR technique.
Sometimes the method described above cannot find these patterns, or there is no certainty that one of the tables is the correct one. Normally this happens when the KIID design is not the usual one, and so the risk scale is not a regular table.
For these cases, we have implemented a second method that is able to "filter" the image by a certain colour, which is then used as a parameter. This colour is precisely the colour in which the risk level on the scale is marked. We could say the robot has to stay focused only on those areas and ignore the rest. Again, all that follows is the extraction of the value from the risk scale.
Both methods perform common secondary processes to facilitate document viewing:
- Erosion and Dilation: allowing image enhancement or focus.
- Binarisation: transforming the image into comprehensible vectors and matrices for the robot.
- Conversion to grayscale, which "eliminates noise" in low-resolution documents.
- Filter by colours.
- Pixel information extraction.
At Jidoka we are continually looking for new challenges. Do you have something to surprise our software robots? If so, do not hesitate to contact us , we will accept the challenge! http://www.jidoka.io/en/contact/