Automate with Confidence

The goal of Intelligent Document Processing (IDP), or indeed any form of document automation, is no-touch or ‘straight-through’ processing, eliminating the need for time-consuming and often tedious manual intervention. Automation is easy, but accurate automation is not: historically, many IDP systems have failed to achieve this key outcome.
Accurate data is always important to some degree, and often the requirement is explicit in the form of a Service-Level Agreement (SLA) between a Document Processing Outsourcer and their client.
Say, for example, the SLA requires 99% accuracy in a classification task. If the automation alone is 95% accurate then on average 4 errors per 100 documents must be corrected to meet the SLA. Without knowing where the errors are, all 100 documents will have to be checked, and most of the efficiency gains from automation will be lost.
This, sadly, is how too many IDP systems are used today – often, document processors have reverted to 100% review after being bitten by inaccurate data and unhappy customers.
Confidence to the Rescue
The solution is for the IDP system to indicate where it is struggling to produce an answer, and therefore guide any manual checking to only a subset of the documents. In our above example, if the system can mark 10 classifications as being ‘low confidence’, and at least 4 of the 5 actual errors are within those 10, then we will be able to achieve the SLA while only needing to check 10% of the documents – 90% can now be fully automated.
Note that, for simplicity, we’re assuming here that a human validating data is always accurate, and in reality that’s not likely to be the case – in practice the IDP system will usually need to over-achieve the accuracy targets to offset human errors.
Can You Trust Your Confidence?
On the face of it then, it might seem that any system that can offer a confidence score is all we need, but unfortunately it’s not as simple as that – a confidence value is only useful if it’s a good predictor of where the actual errors lie, and many are not. To return to our simple example, if 2 or more of the errors occur in the high-confidence results (such errors are often called ‘false positives’), then we’re back to missing the SLA unless we manually check every document. We need to look more deeply at how confidence scores can be used, and how to assess their worth.
Confidence scores from a Machine Learning (ML) system are often expressed in the range 0 to 1, or as a percentage. You should be very wary though of assigning any particular meaning to a percentage unless you’ve had the opportunity to calibrate what it means in practice – a confidence of “99%” certainly sounds good, but it does not mean that the data is 99% likely to be accurate. Put another way, just because the system is confident doesn’t mean it’s right!
Confidence Thresholds and Accuracy
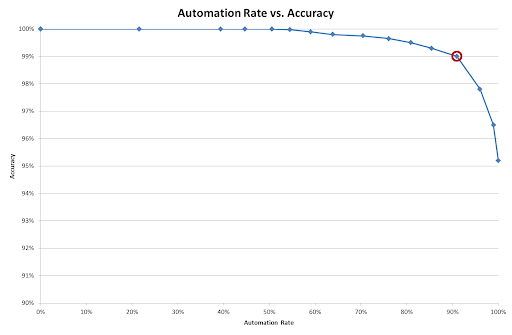
Although we ultimately care about accuracy (the percentage of results that are correct), not confidence, a reliable confidence score does give us a way to drive up accuracy while still retaining the benefits of automation. If we have a confidence score in the range 0-100, we can put a threshold on this score and manually review and data below the threshold. This value needs to be chosen carefully: too high and we will let too many errors through unseen; too low and we will need to review a large proportion of the documents and lose the automation benefits. This trade-off is best shown graphically. The graph below shows an example of classifying a test set of 1,000 documents from the insurance industry into 24 types.

The different points on the graph show different thresholds, with a high threshold on the left, decreasing to zero on the right. The leftmost point shows 100% accuracy (because there are no confident mistakes), but also 0% automation because everything has been marked for review (rejected)! By contrast, the rightmost point shows 100% automation (nothing is rejected) and 95% accuracy based on the ‘best guess’ result.
In between we see the benefits of a reliable confidence score – most of the incorrect classifications had low confidence, and in this instance manually reviewing only 10% of the documents would have enabled us to reach over 99% accuracy (by using the circled threshold value).
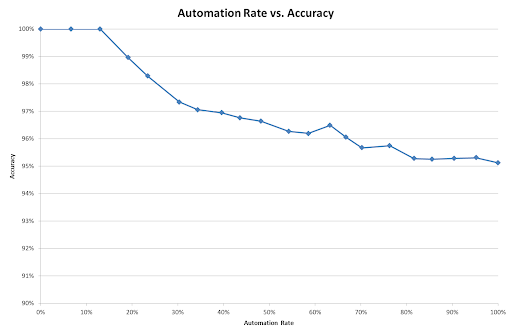
By contrast, let’s look at a poor confidence score. In the graph below, I’ve deliberately sabotaged the confidence values by replacing them with random numbers. Although the endpoints are the same, the graph in between is very different, and now it would be impossible to achieve 99% accuracy without reviewing nearly all the documents.

Although it’s useful to understand the concepts behind confidence thresholds and their impact on accuracy and automation, most people do not have time or inclination to perform these experiments and set thresholds. A good classifier will ‘self-tune’ to a target accuracy by assessing its own performance and setting thresholds accordingly.
Track What You Hack
It’s common to see vague claims about ‘90% automation’ or ‘99% accuracy’. Firstly, armed with the information above, you now know that a single number is not the full story – an automation rate only makes complete sense if accompanied by an accuracy figure and vice versa. Secondly, it's important to ask 'percentage of what?' – a character-level accuracy will always be higher than a field-level accuracy, which in turn will be higher than a document-level accuracy.
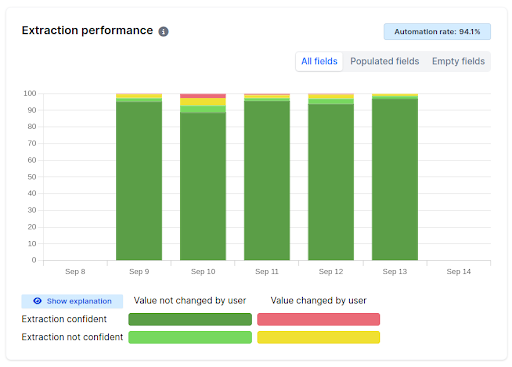
Every project is different, so the only meaningful figures are those based on your own documents; all good IDP systems will provide easy ways to gather and track these. Here’s an example dashboard from a project to extract hundreds of fields from traffic collision reports. The bars show the splits between field values that were captured correctly vs. those that required changes, and between those that were confident vs. unconfident, resulting in four categories overall. We can see a dip in performance on September 10th (less dark green, more red), which in this instance was because of a particularly challenging batch of documents that were poorly filled and scanned.

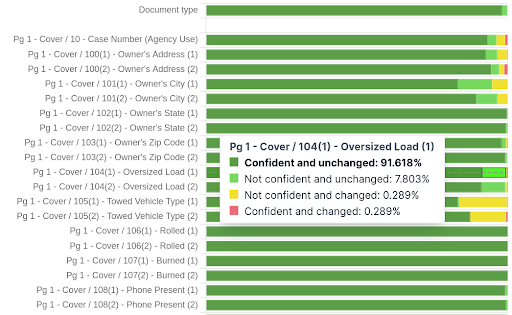
A second view below shows a drill-down into the same figures for some of the individual fields on the documents. This provides actionable insights into where confidence levels may need to be changed or the configuration tweaked.

It’s important to remember that data not presented for review won’t be checked for accuracy, which can distort the figures, so best practice is to perform full review on all documents for a brief period when first deploying a project in order to gather detailed statistics and build trust in the system. Thereafter, a small proportion (e.g. 1%) of documents can be sent to a quality control step for full review, which allows the performance of the automation, and the users, to be tracked over time.
The LLM Dilemma
Large Language Models (LLMs) are getting a lot of attention in the IDP world, and rightly so: on the one hand, they offer an almost magical way to pull complex data from documents with minimal configuration; on the other, they have a number of pitfalls if applied naively, and in particular around the issue of confidence and whether we can trust the data – are they just for toy projects and cool demos, or can they cut it in demanding high-accuracy environments?
At this point, most people have interacted with an LLM using ChatGPT or a similar interface. In this mode, it is easy to gloss over the limitations – if, for example, the LLM displays the well-known issue of hallucination (a.k.a. making stuff up), the user will often spot the issue and ask again or rephrase the question until it gives a better answer. Chat, by its very nature, involves a ‘human in the loop’, and provides a natural nonsense-filter, but IDP is all about removing the human from the loop as far as possible. This is an example of the move from AI as assistant to autonomous agent. But how can we build sufficient trust in an LLM to use it in this mode?
Unfortunately, LLMs are notoriously bad at assigning meaningful confidence to their results. You might be tempted to simply ask an LLM ‘how confident are you in that data?’, but LLMs are trained to tell you what you want to hear: it will likely respond with a pleasingly plausible answer like “90%” or “95%”, largely independent of the actual accuracy!
Those familiar with the technicalities of LLMs will be aware of ‘log probabilities’ which, with a suitable integration, give an indication of the confidence in each token (~word) at output. These can be used to build an overall picture of confidence, but are not usually good indicators on their own. The reason is that the transformer architecture on which LLMs are built is based on a whole stack of layers, and while log probabilities give a reasonable assessment of confidence in the final word selection at output, the important ‘decisions’ about a particular classification or piece of data may have been made many steps previously and will be lost in the final probabilities.
Here’s a simple analogy: say you’re asked to classify a document, and as you form your final answer you’re 50-50 on whether to call it ‘letter’ or ‘correspondence’ - this is equivalent to the probability you’re likely to get from an LLM. However, the more important decision was one made several steps earlier in your thought process – is it correspondence at all, or actually a legal agreement written in the form of a letter? In an LLM, that kind of judgement-call is unlikely to surface in the output probabilities. A person would recognise that the initial decision was more important, and report their confidence accordingly, but that requires a level of self-reflection of which LLMs are not yet capable.
So what to do? At Aluma, we love using LLMs when they’re the right tool for the job, but we don’t use them exclusively, and we always use them with care. Here are some examples of the techniques we use to build a reliable measure of confidence in an LLM’s output:
- Cross-check the results against the original document text (hallucination filter);
- Merge in the OCR/ICR confidence (poor-quality input gives poor-quality output);
- Run the same LLM query multiple times (pick up random variations);
- Have the LLM explain its working (hold it accountable);
- Incorporate the LLMs’ internal probability metrics (‘white-box’ integrations);
- Run the query against multiple LLMs (two heads are better than one);
- Cross-check the results using a different, e.g. rules-based, technique (two different heads are better than two similar heads);
- Sanity-check the final results (validations help weed out lingering errors).
That’s a lot, but the system automatically takes care of most of these behind the scenes, and our experience has been that with these methods in place, it is possible to use LLMs effectively in IDP, even in high-volume projects with demanding SLAs.
Summary (TL;DR Version)
Accuracy is always important in an IDP system, and confidence measures are key to achieving a high level of accuracy without a manual review of all the data. However, not all confidence values are trustworthy, so they should not be depended on without a proper analysis of how they relate to accuracy on a particular set of documents. It is also important to track accuracy over time to ensure that targets are still being met.
The latest generation of AI technology, based on LLMs, is powerful but has specific challenges in the area of accuracy and confidence. These models need to be enhanced with checks and balances to achieve the exacting requirements of a high-end IDP system.
George Harpur is Co-founder and CEO at Aluma. Originally published HERE
